Last Updated on May 19, 2023
There are numerous studies and reports about drinking trends in the United States, but they tend to cover a lot of the same questions around general consumption. In fact, a quick Google search will show you just how much these reports center around the words “binge drinking”, “excessive drinking” and “alcoholism”.
I was struggling to find any compelling data around specific drinking habits in the United States, and how those habits differ by gender, sexuality, industry, income, marital status; the list goes on!
Rather than continuing to grind my teeth at the limited information available, I decided to solve this problem myself. Luckily, being on the team at Sunnyside means being able to get first-hand knowledge on the specific drinking habits of a subset of individuals in the US.
Since Sunnyside is an app that centers around tracking and planning alcohol consumption, I knew that I’d get a much more accurate picture of people’s reported drinking habits, and that the audience would be made up of people who are self-aware of their drinking habits, and actively trying to cut back.
We surveyed 500 of our members to get a better understanding of their drinking patterns, habits, and triggers, as well as certain aspects of their lifestyle and preferences.
Understanding The Types of Drinkers
Throughout this study I’ll be categorizing the respondents into groups based on their drinking behaviors in an effort to simplify the results.
Because the CDC has already established guidelines for various drinking levels and definitions, it’s important that we explain how we’re aligning our definitions.
At Sunnyside, we don’t condone drinking, but rather we accept the fact that a majority of U.S. adults do drink alcohol. In a recent study we ran, we found that 47% of those who drink alcohol have a desire to cut back. Sunnyside is an app and service to support people in finding more balance in their lives by drinking more mindfully.
Here’s how we’re defining the terms in this study:
Healthy Drinker
Although recent studies have shown that any amount of alcohol consumption may be unhealthy, for the sake of our study, we will be referring to healthy drinking as consuming 5 or fewer drinks in a given week with no binge drinking involved. This is below the CDC’s guidelines for moderate drinking.
Moderate Drinker
The CDC defines moderate drinking as consuming 2 drinks or less in a day for men, and 1 drink or less in a day for women. As a result, for the purposes of this survey, we have classified that people who reported consuming between 6-15 drinks per week fall into the category of moderate drinkers.
Excessive Drinker
Excessive alcohol use is an umbrella term that includes:
- Binge Drinking: Consuming 4 or more drinks in one occasion for women, or 5 or more drinks in a single occasion for men.
- Heavy Drinking: Defined as 8 or more drinks per week for a woman, or 15 or more drinks per week for a man.
For the sake of our study, we have grouped individuals consuming more than 15 drinks per week into the category of excessive drinkers.
Alcohol Consumption Statistics for 2022 [Infographic]
We analyzed and cross-referenced over 11,000 data points to get a full picture of drinking habits in the United States. This infographic summarizes only a small subset of the statistics, but read on to learn about drinking habits in the US.

24 Statistics About Drinking Alcohol To Know in 2022
Read on to see how drinking habits differed by gender, income, location, frequency, sex and more:
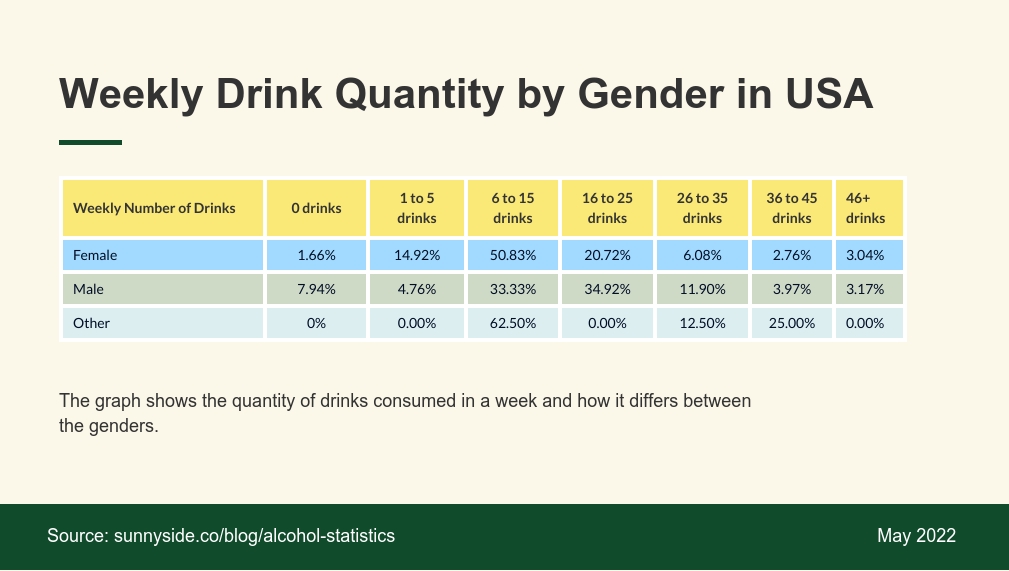
1) How did the quantity of drinks consumed in a week differ between genders?
When asked about the number of drinks consumed in a given week, on average, men were much more likely to binge drink at higher rates than women, or undefined genders. In fact nearly 54% of men surveyed consumed more than 16 drinks in a given week, compared to the women surveyed where 33% of them reported drinking more than 16 drinks in a given week.
The majority of women surveyed, close to 51%, were drinking 6-15 drinks per week. For women, this suggests the majority surveyed are excessive drinkers.
Although we did also survey non-binary individuals, and non-identifying genders, the number of respondents was too low to see statistical relevance. Of those who were surveyed, the majority indicated drinking 6 to 15 drinks a week.
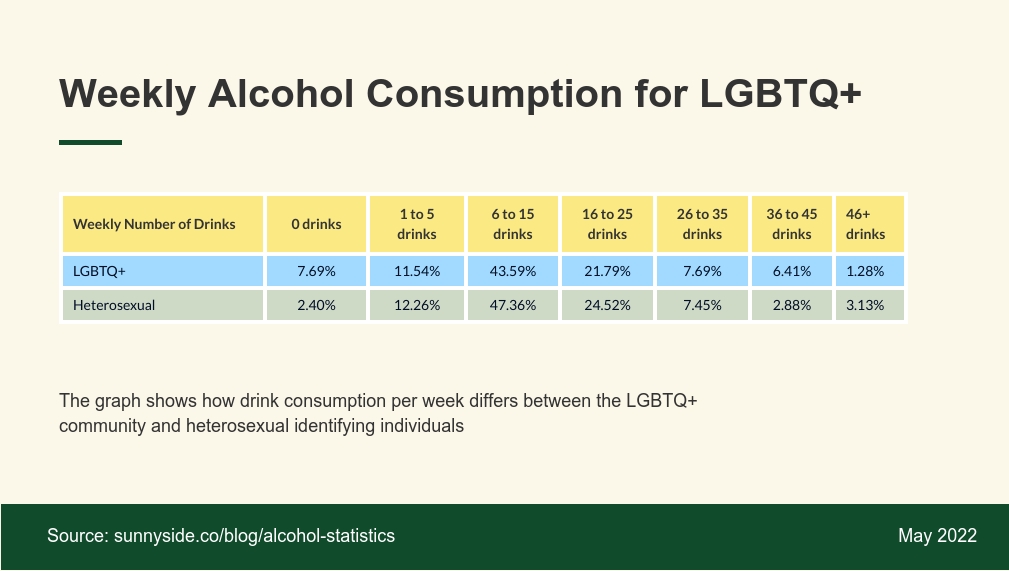
2) How did alcohol consumption per week differ between the LGBTQ+ community and heterosexual identifying individuals?
Based on the survey research, we learned that sexuality does not strongly determine weekly drink quantity. Close to 37% of members of the LGBTQ+ community reported drinking 16 or more drinks per week, compared to 38% of heterosexual respondents.
Comment from Sunnyside’s Founder, Ian Andersen:
We found that excessive levels of drinking impact everyone, regardless of sexual preference. Excessive drinking, defined by the CDC as more than 14 drinks per week for men and more than 7 drinks per week for women, has only gone up since the pandemic started in 2020, leading to many people seeking more balance in their drinking habits.
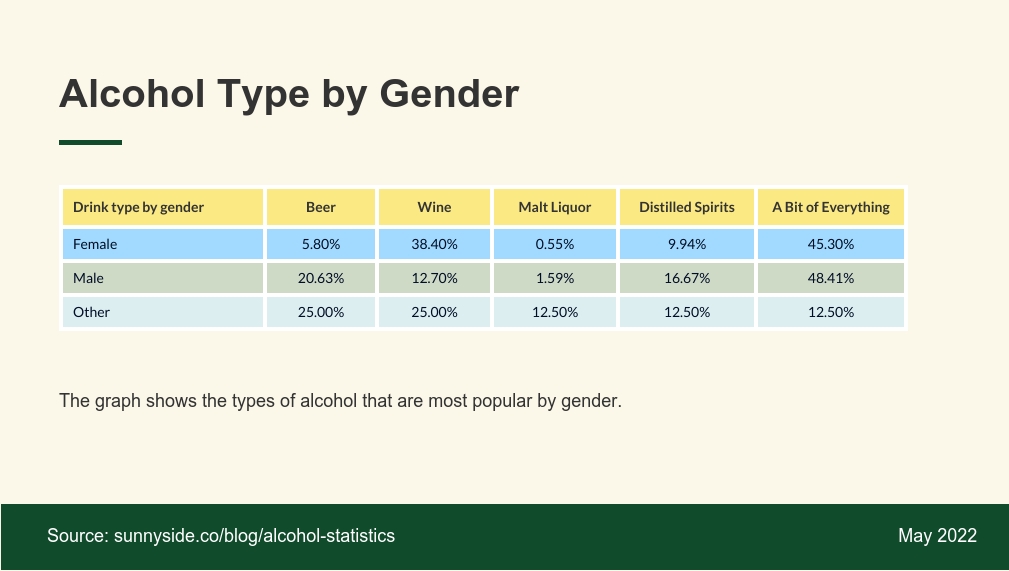
3) Which types of alcohol are most common across different genders?
Though most respondents drank a combination of alcohol types, wine was the next most common drink of choice among women with 38% of respondents indicating drinking almost exclusively wine. Only 13% of men indicated drinking predominantly wine. Beer was more popular among men (21%) and non-identifying individuals (25%).
Men were the most likely to drink a combination of beer, wine, malted drinks and spirits, with 48% indicating enjoying a mix of everything.
Comment from Sunnyside’s Founder, Ian Andersen:
A major trend in the mindful drinking movement is the explosive growth of non-alcoholic beers, wines, and liquors. These alternatives are providing consumers with more options to add to their households, and helping satisfy the cravings that can come at the end of a long work day. While we don’t anticipate a shift in the data above, we do expect more and more consumers to start adding options to their bar carts in the coming years.
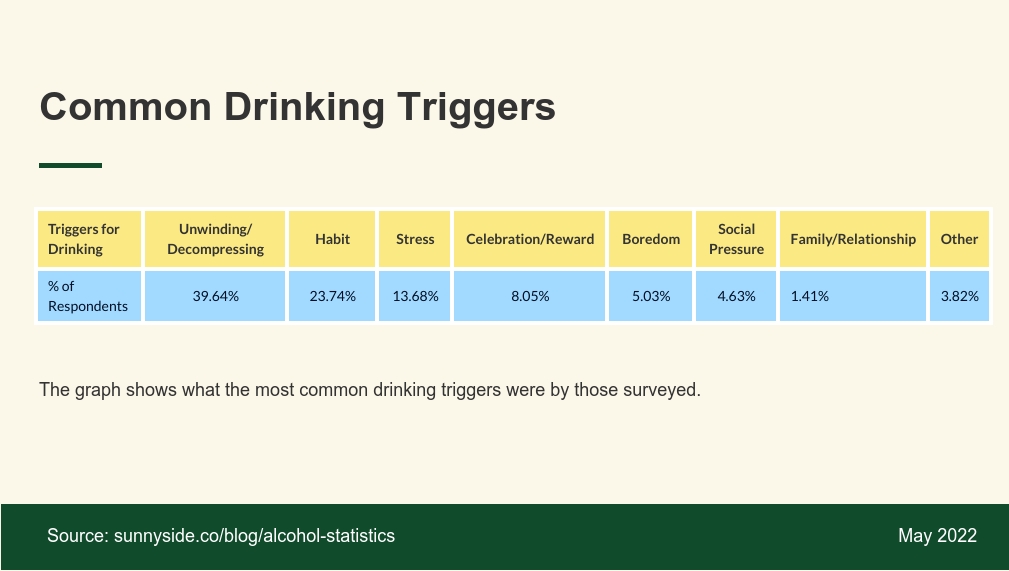
4) What were some of the most common triggers for drinking across those surveyed?
Close to 40% of respondents indicated that their biggest trigger for drinking was decompressing after a long day.
This was followed by 24% of respondents indicating that their biggest trigger was habit, followed by 14% of respondents selecting stress as their biggest trigger.
Celebration and reward was a trigger for 8% of respondents, and the remainder selected either social pressure, family or relationships, and other.
Comment from Sunnyside’s Founder, Ian Andersen:
Since we started Sunnyside in 2020, the most common reported trigger for drinking has been, simply, the end of a stressful day and the desire to unwind. While we’re not opposed to this at all, we noticed Sunnyside members reporting that the end-of-day drink was turning into 2 or 3 during the pandemic. The added stress of staying home all day and having to take on more care and responsibilities naturally has led many people to realize their daily unwind drink was becoming a bit unhealthy, thus leading to a desire to cut back and seek more balance.
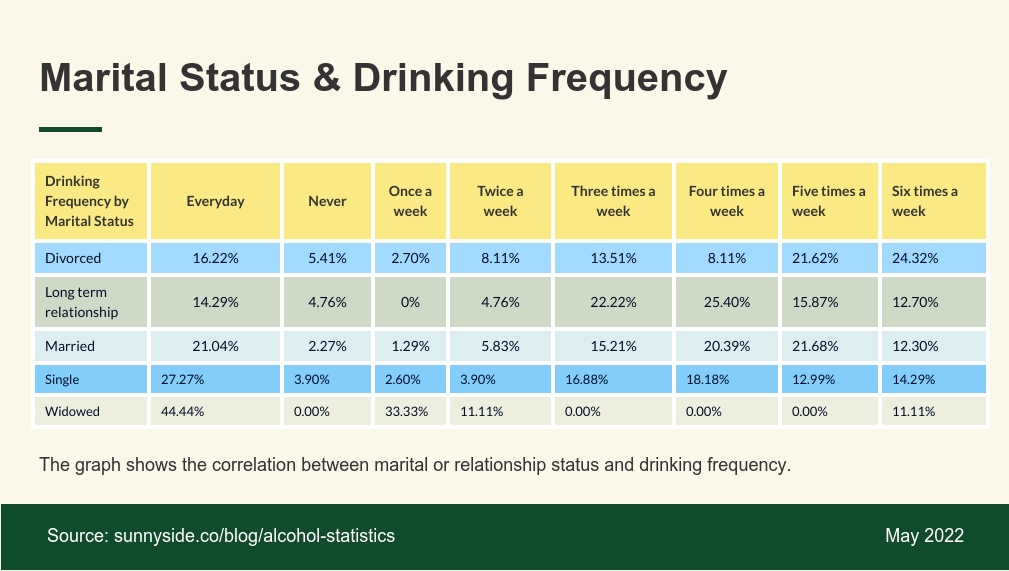
5) How did marital status impact drinking frequency
We cross-referenced the survey data to identify how marital status correlated with drinking frequency.
Interestingly, 70% of divorced respondents indicated drinking more than 3 times per week compared to 75% of married respondents.
Of the single respondents, 73% indicated drinking more than 3 times per week, and those in long-term relationships came in at 68% drinking more than 3 times per week.
Of the widowers who responded, 56% drank more than 3 times per week, however the number of respondents who were widowers was too low for this to be truly relevant.
In a nutshell, we can gather from this data that married individuals drink the most frequently in a week compared to those in a long-term relationship.
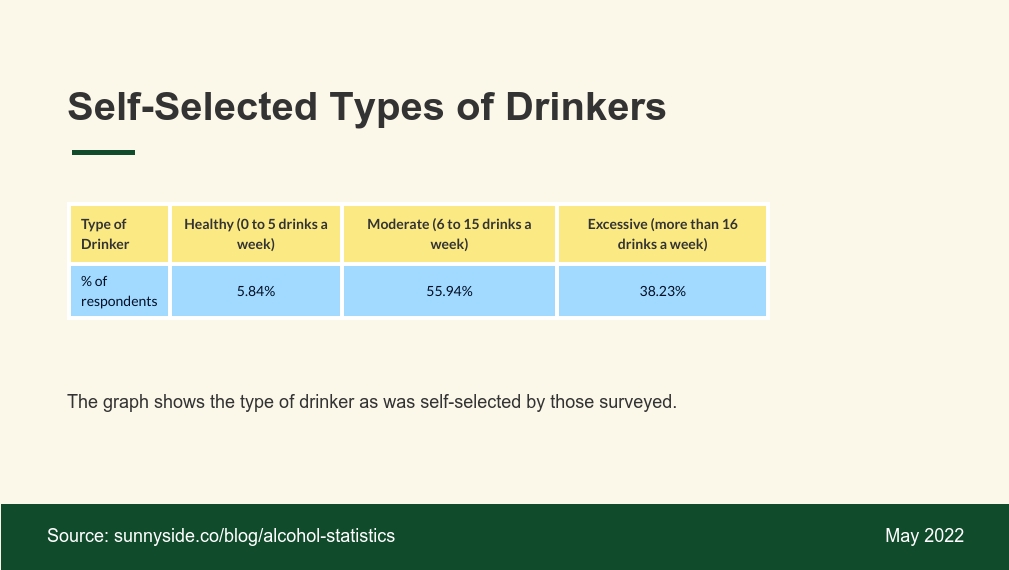
6) What type of drinker did respondents self-identify as?
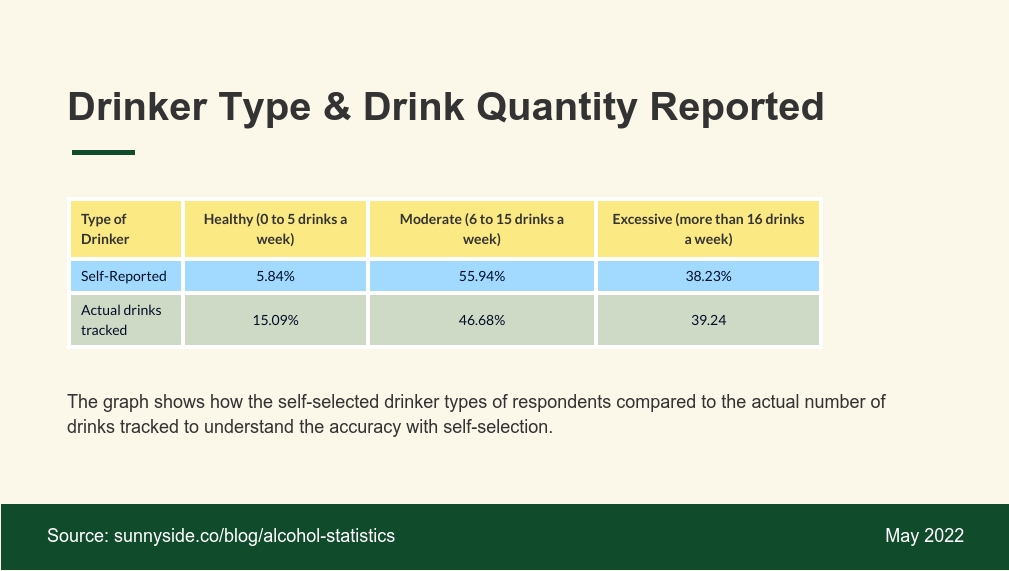
We asked those surveyed to self-select the type of drinker they considered themselves to be, not taking quantity into consideration. Close to 56% self-selected as moderate drinkers, 38% self-selected as excessive drinkers, and only 6% self-identified as healthy drinkers.
7) How did that compare to reported weekly drink consumption?
We were curious to see how self-reported drinking type compared to the actual number of drinks tracked in a week.
We cross-referenced what they self-selected and compared it to the weekly drink quantity reported.
The most aware and accurate reporting was among the group of excessive drinkers, where 38.23% self-reported as excessive drinkers, compared to actual drinks tracked at 39.24%.
However 5.84% of respondents self-reported as healthy drinkers, but based on the actual drinks tracked, we found that 15.09% of respondents were actually exhibiting healthier drinking behaviors.
Comment from Sunnyside’s Founder, Ian Andersen:
The fact that approximately 40% of those surveyed know that they are drinking excessively and 47% of US adults who drink have a desire to cut back indicates a huge gap in alcohol health. Given the rise of low-cost, easily accessible services like Sunnyside that focus on education and habit change, we believe a major shift is underway to provide solutions that meet people where they are in terms of their alcohol health needs.
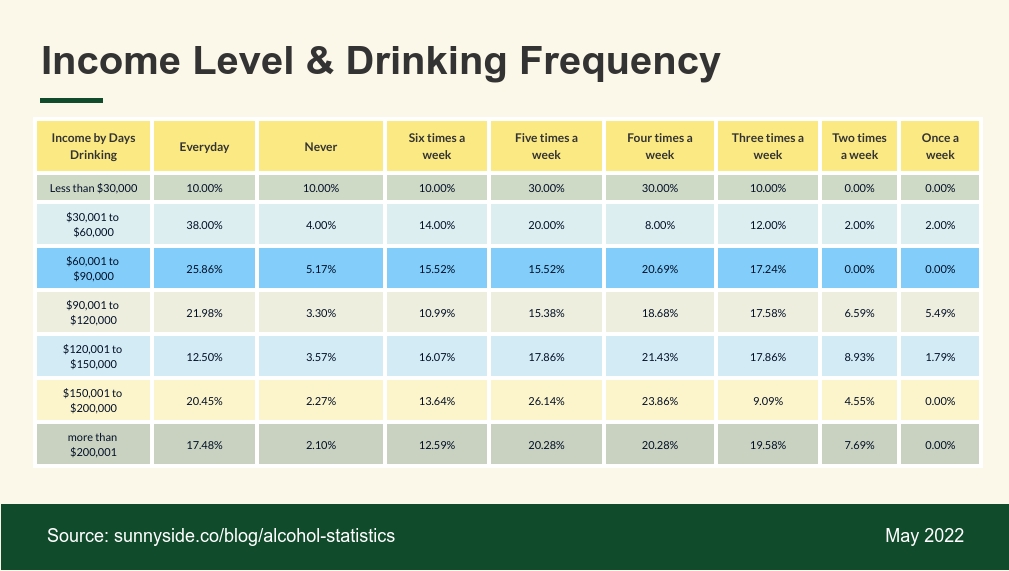
8) How did income level affect the amount of days in a week that people did or did not drink?
People making between $90,001 and $150,000 per year had the fewest drinking days, with 32.6% averaging fewer than 4 drinking days per week.
84% of respondents who made between $150,001 to $200,000 reported drinking more than 4 days per week, making this income range the most frequent drinkers among those surveyed.
The second most frequent drinkers were those making less than $60,000 a year, with 80% indicating drinking more than 4 days per week.
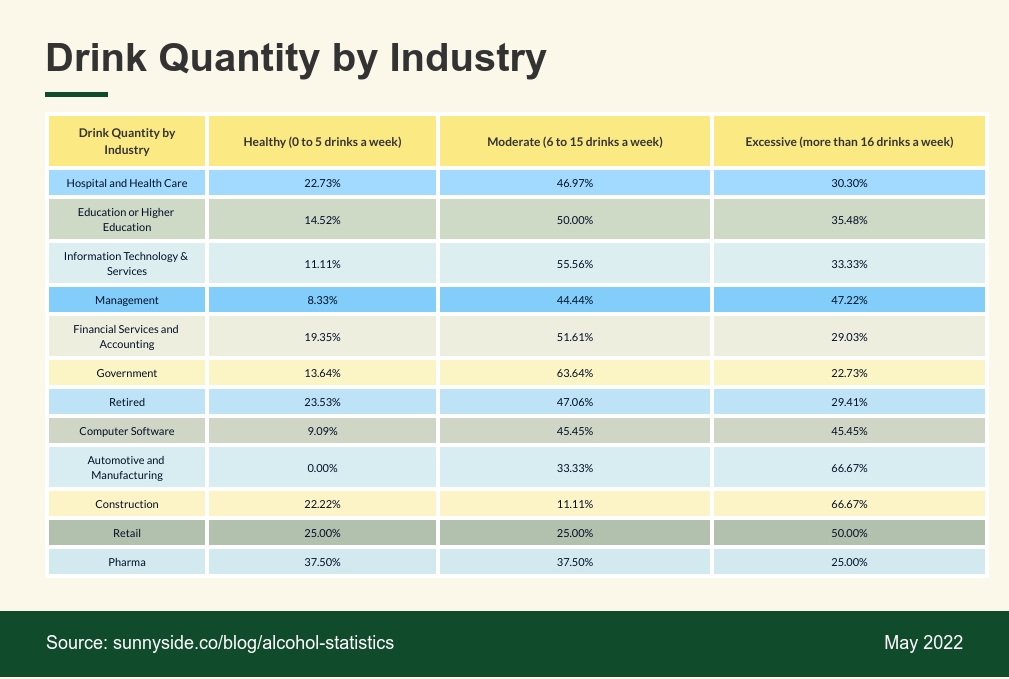
9) How did the drinking quantity differ by industry?
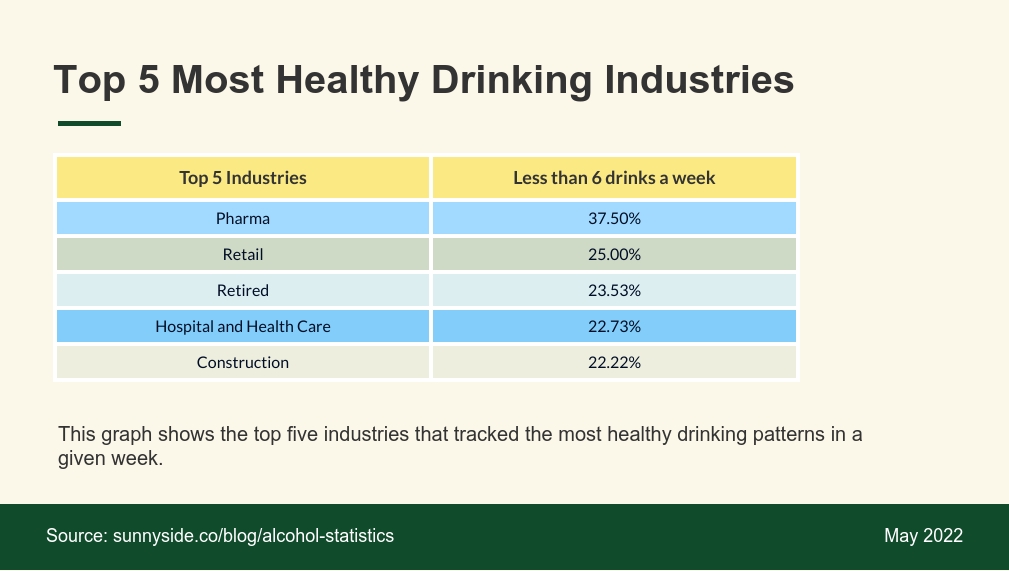
After looking at drinking quantity by industry we learned that those who reported working in the pharmaceuticals industry were most likely to exhibit healthier drinking habits, with close to 37.5% drinking less than 5 drinks per week.
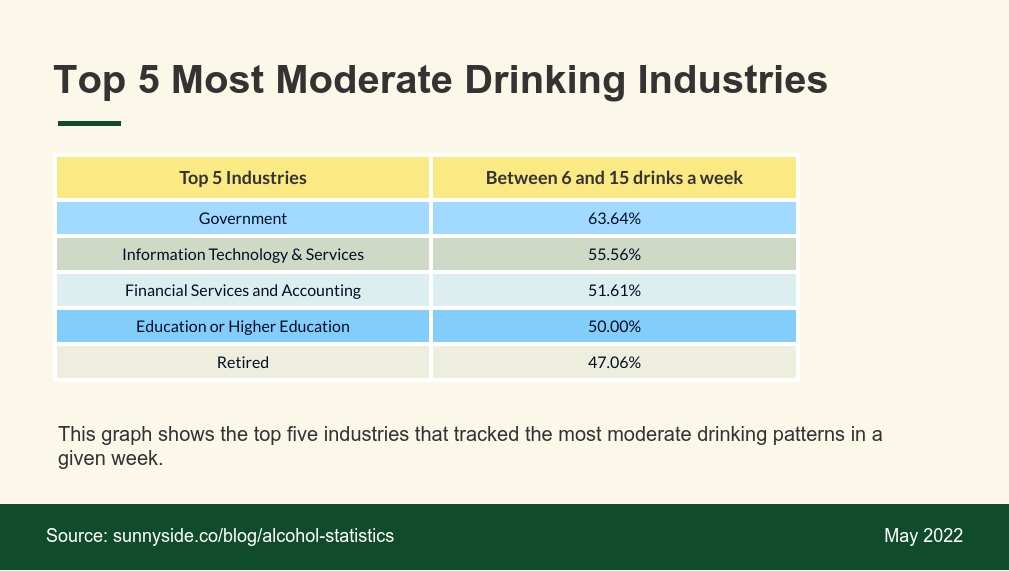
Government employees were the most likely to exhibit moderate drinking behaviors at 64%.
And 67% of those in the automotive industry reported being excessive drinkers, along with the construction industry.
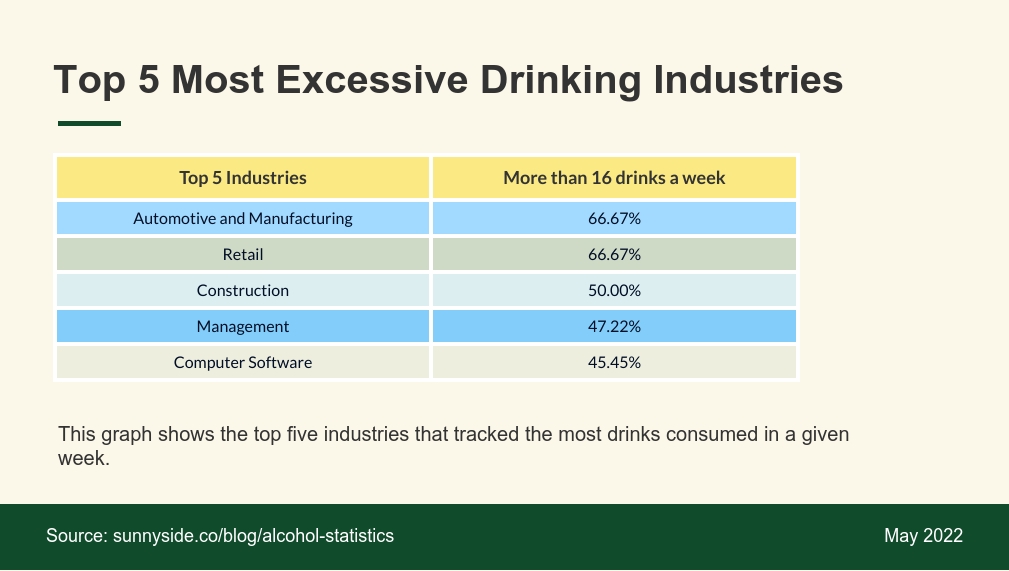
10) Which industries reported being the heaviest drinkers?
We also looked at the top 5 excessive drinking industries overall. This again was defined as industries averaging 16 or more drinks per week per person.
11) Which industries reported being the most mindful or moderate drinkers?
The following are the top 5 moderate drinking industries, based on people within these industries drinking between 6 and 15 drinks per week.
12) Which industries reported being the most healthy drinkers?
Lastly we looked at the healthiest drinking industries, which was made up of individuals within these industries consuming 5 or less alcoholic beverages per week.
Comment from Sunnyside’s Founder, Ian Andersen:
Nearly all industries had a spread of healthy to excessive drinking, which is to be expected. We’re not sure why Automotive, Manufacturing, Retail, and Construction reported the highest rates of excessive drinking, but it may correlate to the requirement for those industries to be out of the home interacting with other people during the pandemic. Interestingly, Retail ended up near the top of the most excessive industries list and topped the healthiest industries.
13) Which industries self-identified as excessive drinkers, and how accurate were they?
The top industries to report as excessive drinkers were those in the construction industry, with 55.56% self-selecting as excessive drinkers, followed by the retail industry, with 42.86% self-selecting as excessive drinkers.
Government employees self-selected as the least likely to be excessive drinkers, with 22.73%.
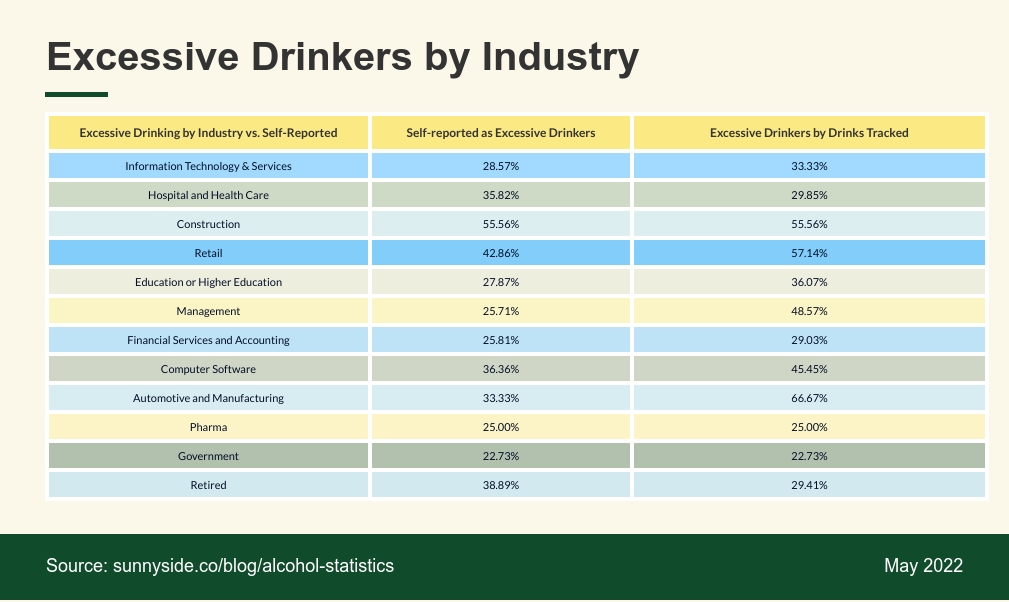
The reality is that automotive, construction and retail industries were the most excessive drinkers based on actual drinks tracked.
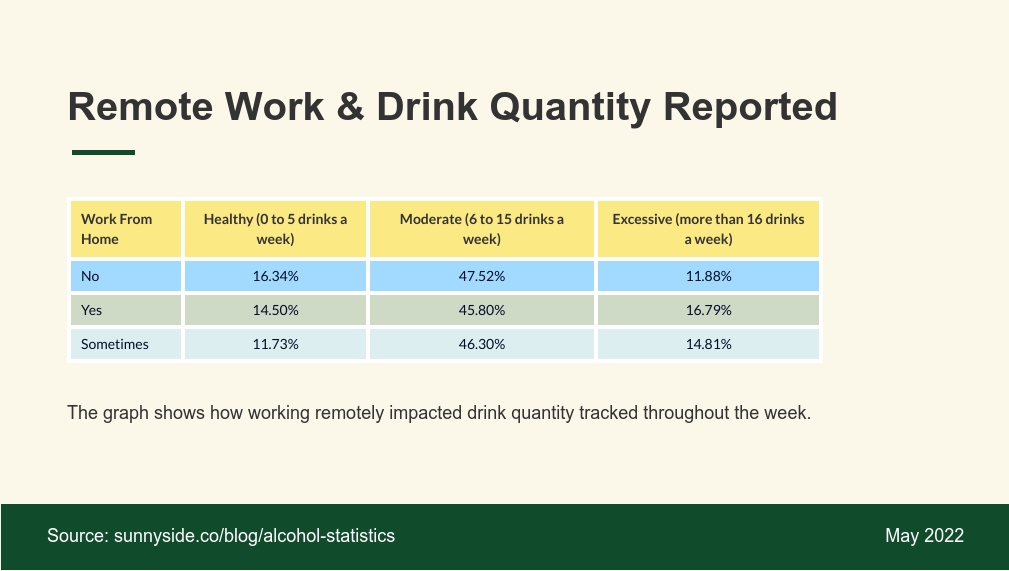
14) How did working remotely impact drink quantity?
For the most part, the majority of respondents, regardless of whether they worked from home, were moderate drinkers.
However 17% of people who worked from home all the time, were more likely to be excessive drinkers compared to those who didn’t work at home, coming in at 12%.
Comment from Sunnyside’s Founder, Ian Andersen:
Ian’s Comment: During the entire pandemic, we’ve heard time and time again that working from home creates added stress to the day, which often leads to a bit more drinking during the week to unwind. We see in our data a meaningful correlation between working home and excessive drinking.
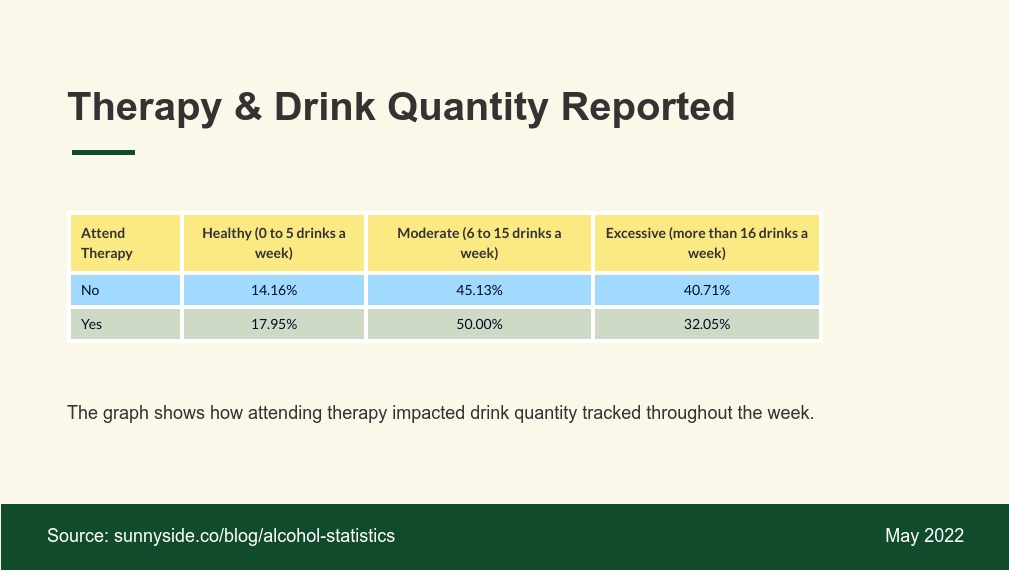
15) How did drinking habits differ between people in therapy and those not in therapy?
On average, people who go to therapy are less likely to fall into excessive drinking habits.
Comment from Sunnyside’s Founder, Ian Andersen:
The fact that those in therapy drink less excessively is of no surprise to us here at Sunnyside. Research shows that modern approaches to alcohol health, such as behavioral change through apps like Sunnyside, can have a profound positive impact. In addition, the root cause of excessive or problem drinking is often connected to unresolved trauma or ongoing depression. Therapy allows people to work deeply on themselves to understand triggers, which can help decrease reliance on alcohol for self-medication.
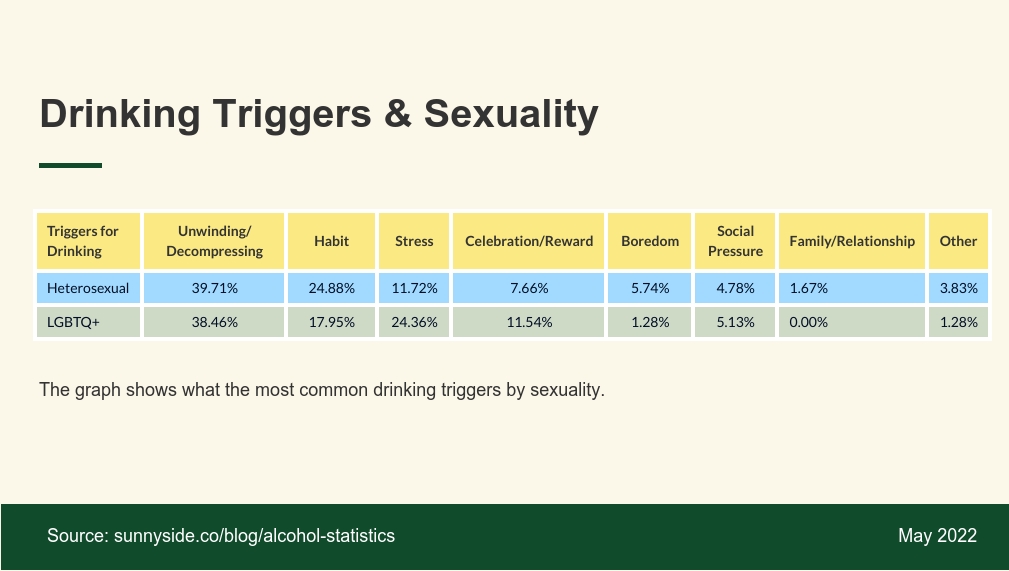
16) How did triggers differ by sexuality?
The majority of respondents, regardless of sexuality indicated their biggest drinking triggers were unwinding or decompressing, averaging 39%.
Though following that, drinking out of habit was the second biggest trigger among heterosexual respondents, at 25%.
However for LGBTQ+ identifying respondents, stress was the second biggest trigger with 24% of respondents selecting this as their main trigger.
This could be due to the added stress factors of being part of a marginalized group of society.
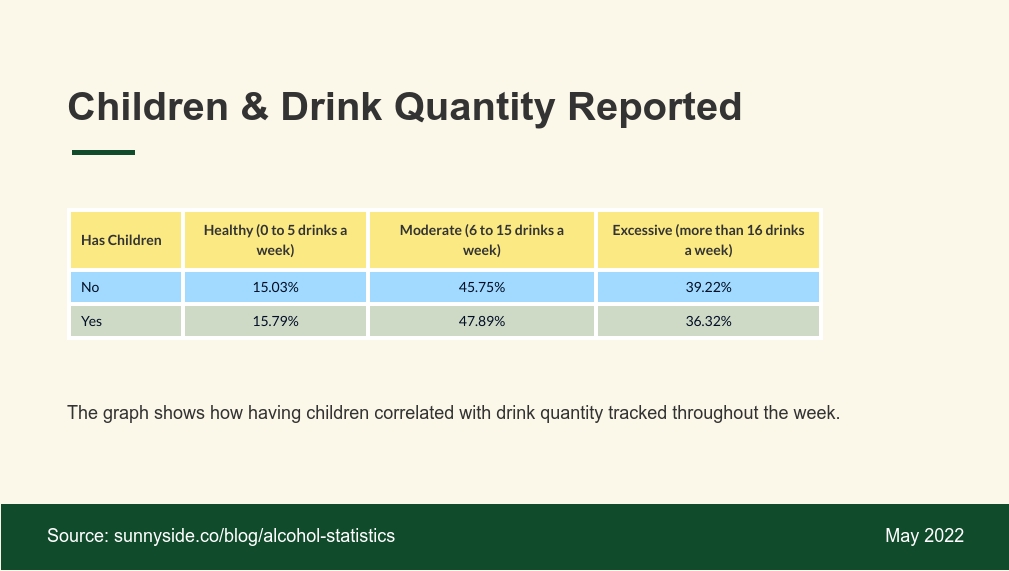
17) How does having children impact the quantity of alcohol consumption?
Overall, having children seemed to correlate with higher excessive drinking habits, with 39% of parents reporting drinking more than 16 drinks per week.
That being said, the behaviors of parents compared to those without any children did not differ drastically.
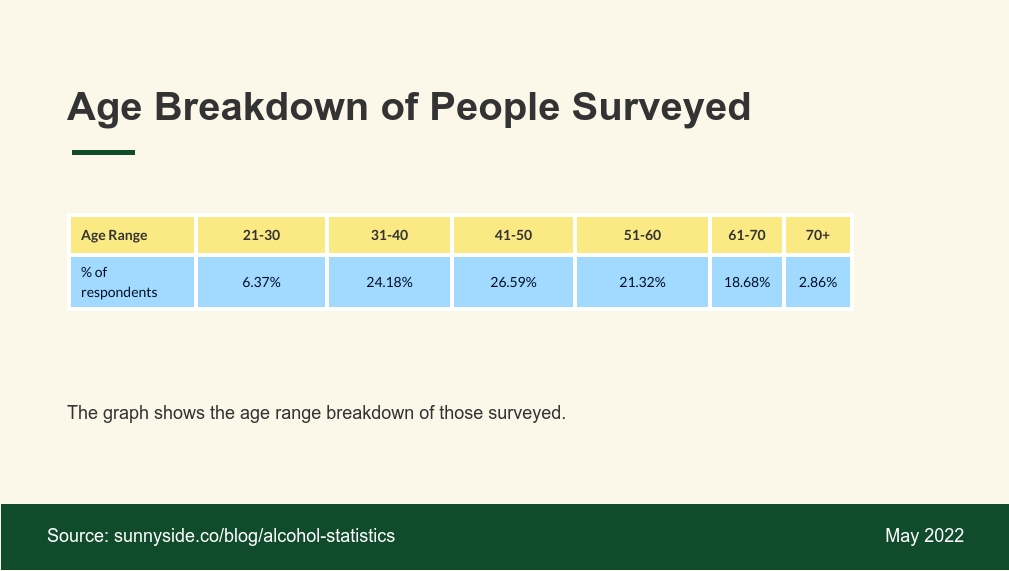
18) What was the age breakdown of respondents?
The majority of respondents we surveyed for this study were between the ages of 30 and 60. In fact they made up 72% of all those surveyed.
Considering the nature of Sunnyside’s app, it also suggests that this is the age range most interested in cutting back their alcohol consumption in general, and also represents individuals generally in more stressful stages of work-life.
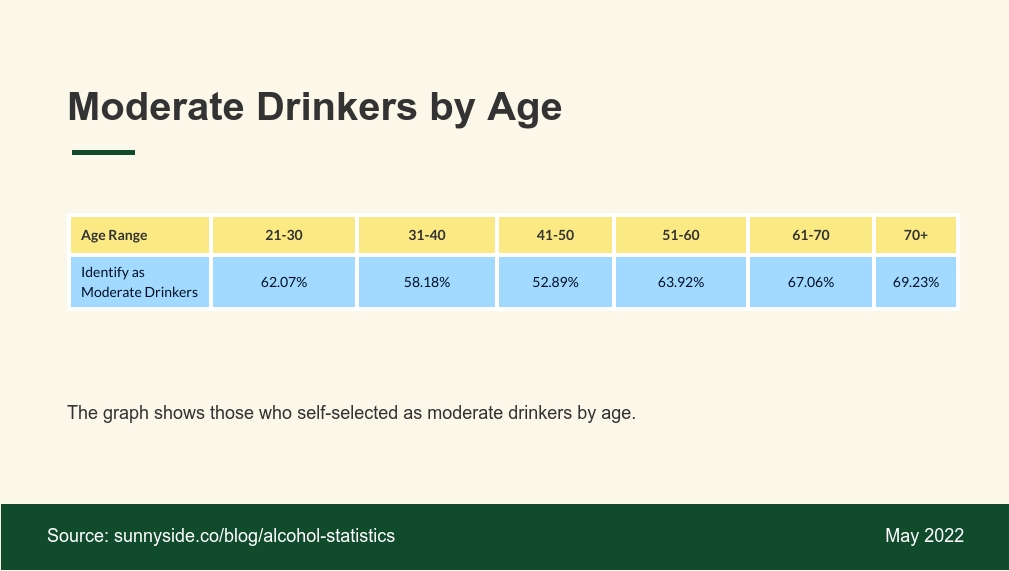
19) How did self-selecting as a mindful or moderate drinker differ by age range?
Those within the age range of 41 to 50 had the lowest percentage of people self-selecting as moderate drinkers with 53%.
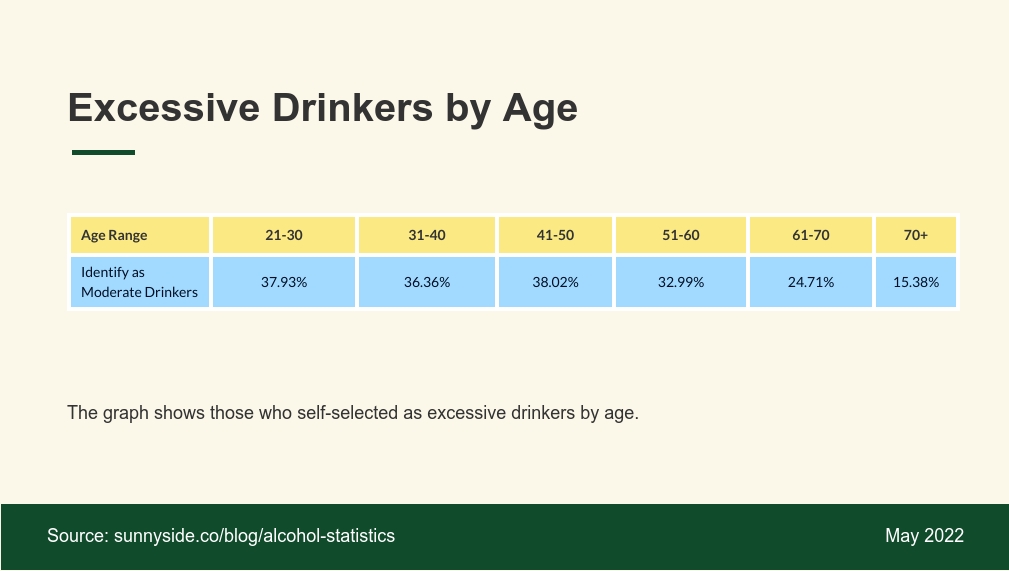
20) How did self-selecting as an excessive or binge drinker differ by age range?
Compared to the above statistic, those within the age range of 41 to 50 also had the highest percent of respondents self-select as excessive drinkers at 38%.
Comment from Sunnyside’s Founder, Ian Andersen:
While we see a big shift in available alcohol-health services happening today, we do believe that the older, aging population may be at a disadvantage when it comes to utilizing modern, high-tech approaches to cutting back on alcohol consumption. These services can feel intimidating or difficult to start. At Sunnyside, we’re able to help these older populations by offering the core experience via text-message, a method that’s familiar and friendly.
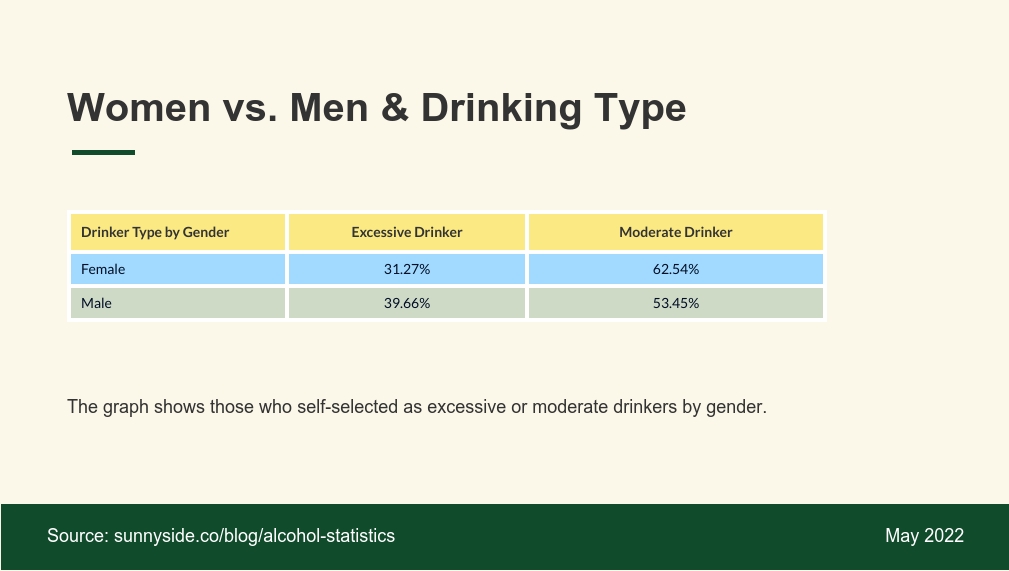
21) How did women’s responses compare to men’s when it came to identifying as a mindful drinker or excessive drinker?
Close to 40% of men self-identified as excessive drinkers compared to 31% of women. As for moderate drinking, close to 63% of women identified as moderate, compared to 53% of men.
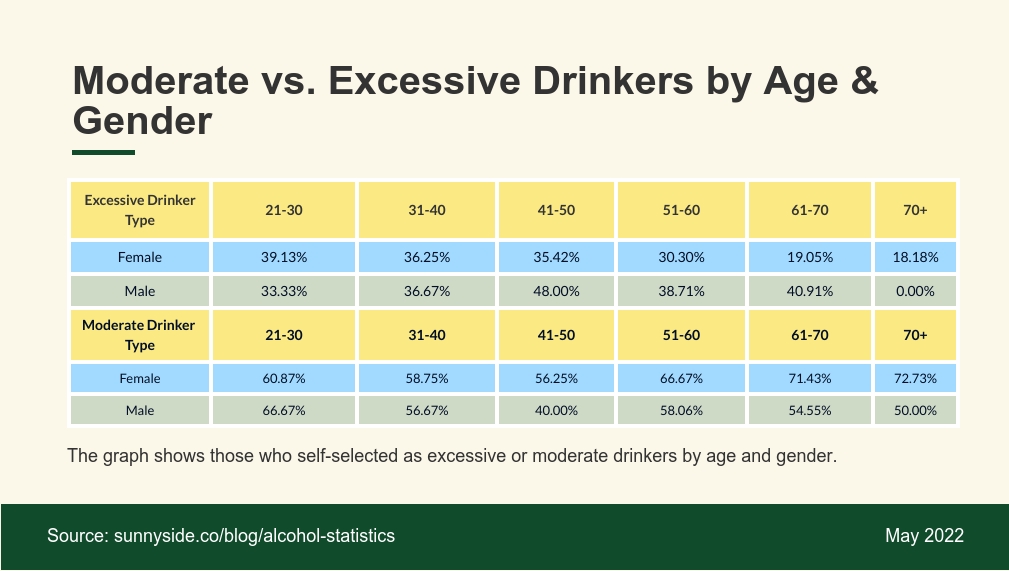
22) How did that compare by age range?
Men between the ages of 41 and 50 were the highest self-reported excessive drinkers with 48% of men in that age range identifying as such.
Women between the ages of 21 and 30 were the highest at self-selecting as excessive drinkers at 39%.
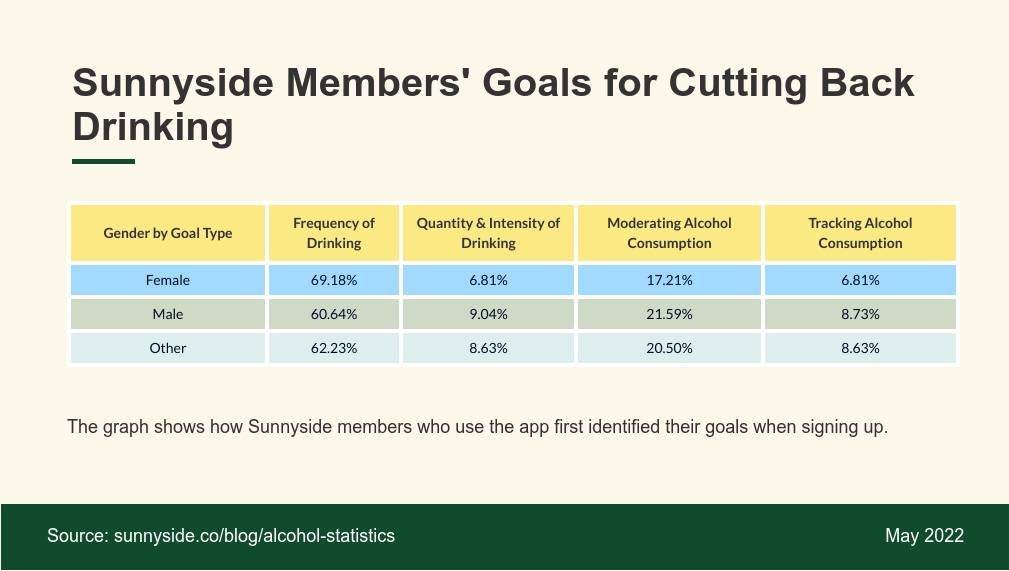
23) What were Sunnyside members’ top goals when it came to reducing alcohol intake?
The majority of Sunnyside members wanted to reduce the frequency of their drinking, which typically means reducing the number of drinking days in a given week.
For women, 69.18% wanted to reduce frequency of alcohol intake and 6.81% wanted to reduce intensity as their top goals.
17.21% of women wanted to work on moderating their intake, and 6.81% simply wanted a way to monitor and track their alcohol consumption by using Sunnyside.
For men, 60.64% wanted to reduce frequency, 9.04% wanted to reduce quantity consumed in a given week, 21.59% wanted to work on moderating their drinking, and 8.73% wanted to monitor their consumption.
Lastly for non-specific genders, 62.23% were focused on reducing their frequency, 8.63% on the quantity, 20.50% on moderating intake, and 8.63% on monitoring what they were drinking.
Comment from Sunnyside’s Founder, Ian Andersen:
Adding more dry days in a week, even if not necessarily reducing the overall amount of alcohol, can be a big win for people trying to build healthier drinking habits. Dry days help the body rest and hydrate, they can improve liver health, and they can break the daily habit of drinking that can lead to anxiety. Members who add dry days back into their weeks report more clarity, energy, and an overall improved sense of wellbeing.
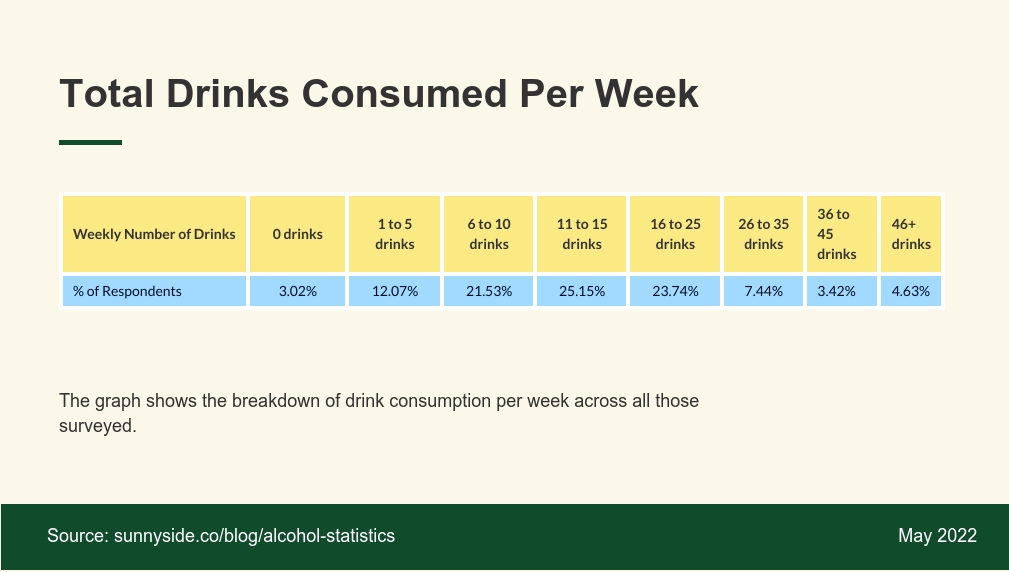
24) What was the average amount of drinks consumed a week by all respondents?
Of all the people surveyed, 64% of all those surveyed drank more than 10 alcoholic drinks a week.
Final Thoughts
Based on the results of this survey we can see that consumption behaviors from our respondents indicate that excessive drinking is high in the United States. Many respondents are drinking a high quantity of alcoholic drinks on a daily basis, and many are exceeding the recommended quantities that are laid out by the CDC.
With Sunnyside we have noticed that within their first 30 days, our members cut back their drinking by nearly 30%, which leads to an average of 1,500 calories cut, and $50 saved
Becoming more mindful and aware of how we drink alcohol, and what the overall relationship with alcohol is, is crucial in taking the steps to cutting back.
Through hundreds of thousands of conversations with Sunnyside members, we know and understand that most people who want to build healthier drinking habits do not want to quit. Sunnyside provides an easy-to-use, low-cost solution to cutting back on drinking and improving overall health, with no pressure to quit.
If you’re ready to start building healthier drinking habits, take the 3-minute quiz with Sunnyside to get started.


